
|
Genome Expression Pathway Analysis Tool
Gene expression analysis with microarrays opened a new insight in the
living cell, revolutionizing biological research in many fields.
Although there exist a large number of data analysis tools available
for these steps, most of them lack the ability to help with the
interpretation of the results. For this reason we developed a web-based
tool, Genome Expression Pathway Analysis Tool (GEPAT), offering an
integrated analysis of transcriptome data under genomic, proteomic and
metabolic context.
|
|

|
Data Import
GEPAT imports various formats of oligonucleotide arrays, cDNA arrays
and data tables. At the moment many human microarray chips are
supported, more chips and species will follow. A gene annotation
database was build based on the UniGene and Ensembl databases, allowing
gene identification for the probes on the microarray chip. Missing
value imputation, background correction and normalization methods can
be applied to the data.
|

|
Gene Information
For an interpretation of the result genes, GEPAT uses data from the
Ensembl database and provides information about gene names, chromosomal
location, GO categories and enzymatic activity for each probe on the
chip. Gene interaction and association data from the STRING database,
overlaid with analysis results, e.g. fold change values, can be used to
find functionally related genes. SMART protein domain information and
literature references are available as well. |

|
Data Analysis
Our tool offers various analysis methods for gene expression data.
Hierarchical, k-means and PCA clustering methods allow group detection
in probes and samples. With these detected groups or a predefined group
set, a linear model based t-Test can be used to identify differences in
gene expression between groups. An M/A-Plot, filtering and sorting on
fold-change, p-value and probe variance allow a quick identification of
differentially expressed genes.
|

|
Data Interpretation
GEPAT uses enzymatic information for the genes to overlay analysis
results onto KEGG pathway maps, allowing an overview of the regulation
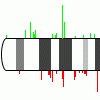
of metabolic pathways. To check for chromosomal aberrations a
chromosome overview can be generated, showing analysis results and
optional CGH data on the chromosome set. For a further investigation of
gene functions, a tree view of the Gene Ontology graph has been
implemented. |